04 Own product · Web game
Desde Abril
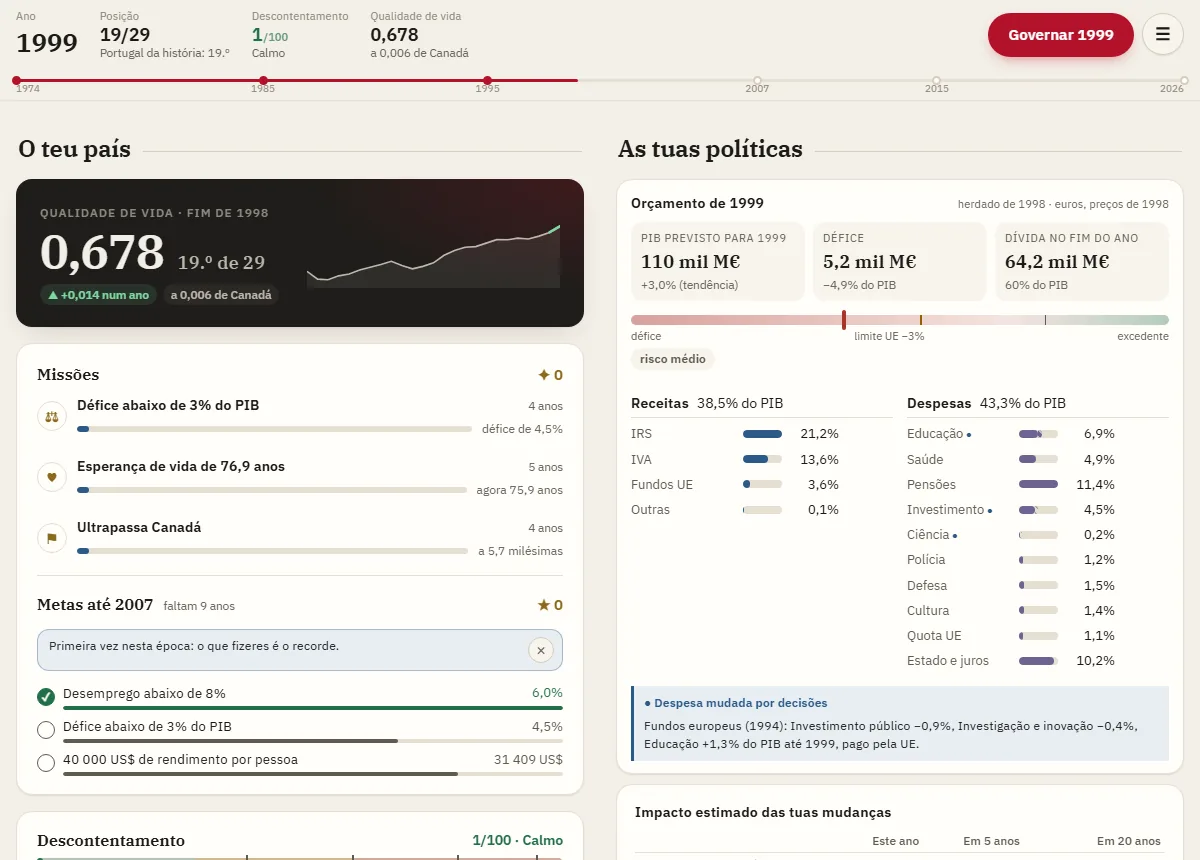
Desde Abril is a free game in Portuguese where the player governs Portugal from the Carnation Revolution to today. They set each year’s budget and face the decisions the country faced, from joining the EEC to the euro, from the IMF to the pandemic.
A
Context
People argue a lot about what Portugal should have done since 1974, but hardly anyone can try the alternatives. The simulators that exist are either games without data or models only an economist would open.
B
The challenge
A game like this is only honest if playing as the real country gives back real history, and if every policy effect has a source. And it still has to be a game people understand on a phone.
What we built
- 01
Engine on real data
Starts from Portugal’s real series and simulates only the difference the player’s choices make.
- 02
Sourced effects
Every effect comes from a published study, with its range and source visible in the game. Whatever is still an estimate is labelled as one.
- 03
Forecast before deciding
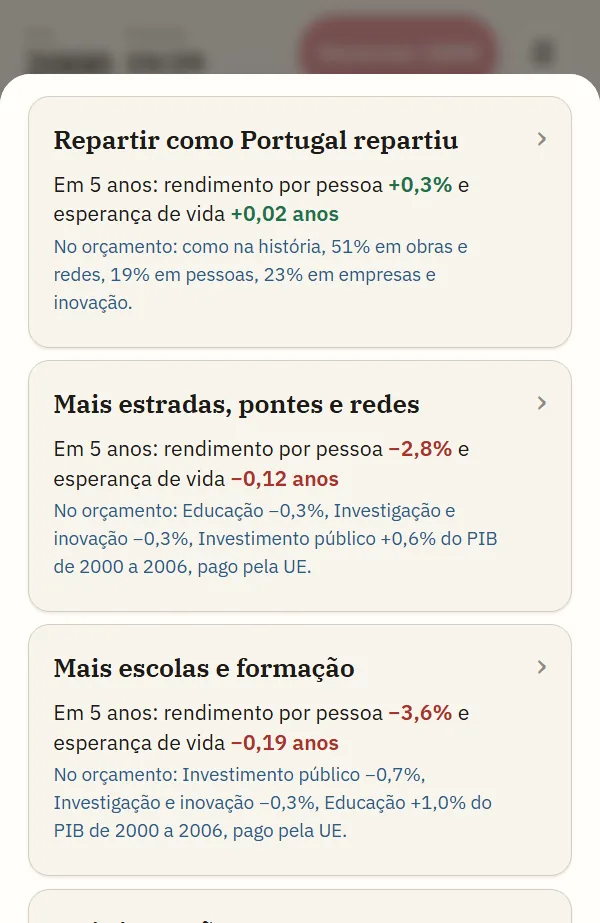
Before each choice, the game shows the impact now, in 5 and in 20 years, and the events that choice causes or avoids.
- 04
Decisions from history
34 decisions, from applying to the EEC to TAP, plus the crises the player can bring about. Each option says what it does to the budget, and EU funds only count while the country is in the EEC. Works offline and installs as an app.
- 05
Reforms from other countries
17 policies other countries applied, with studies using a comparison group showing they worked, from Norway’s pre-school to France’s speed cameras. Each becomes available from the year the other country introduced it.
- 06
Map of the country
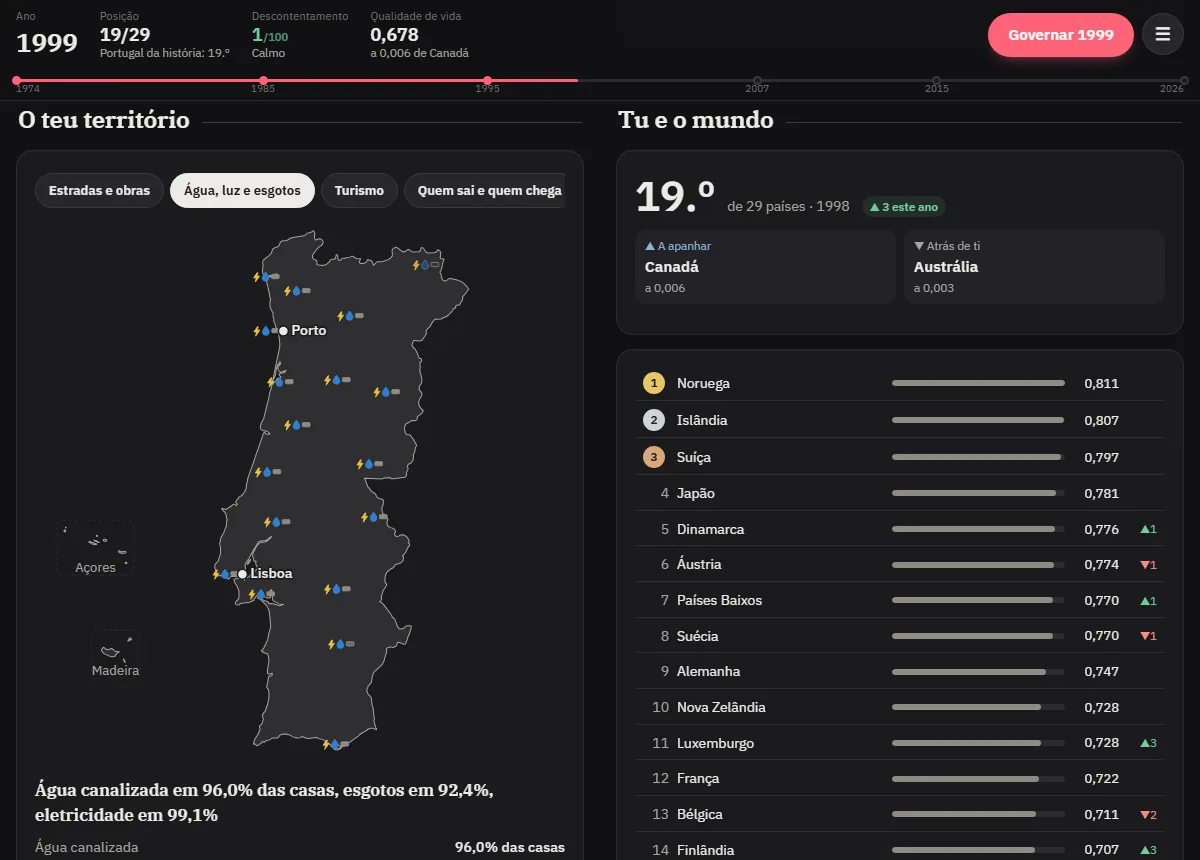
Roads, public works, water, power and sewers appear on the map as investment arrives.
- 07
Four levels
From Very easy, with 5 policies and a forecast in words, to Hard, with all 18 policies and every indicator.
- 08
Compared with the world
A quality of life index ranks Portugal among up to 38 OECD countries, year by year.
By the numbers
- playable years
- 52
- policies
- 18
- effects from studies
- 94
- OECD countries
- 38
Technology
- Application
- Framework-free JavaScript
- SVG for the map and charts
- Designed for phones
- Engine
- Yearly simulation in JavaScript
- Evidence library in JSON
- Tests that replay real history
- Data
- World Bank, Eurostat, INE, Pordata and Our World in Data
- Series processed in Python
- Publishing
- Firebase Hosting
- Feedback by email through a Supabase function
Working on something similar?
Tell us what you need. Every message gets a personal reply.
Get in touch